
The Mission/Money Matrix is a visualization of an organization’s portfolio of programs and activities. Steve Zimmerman and Jeanne Bell, writing in the Nonprofit Quarterly in 2014, outline just why this resource can be so powerful: It is “a visual tool that plots all of the organization’s activities—not just its programs—in a single, compelling image”
STEVE ZIMMERMAN AND JEANNE BELLBy illustrating the organization’s business model through a picture of all activities and the financial and mission impact of each one, it supports genuinely strategic discussions.
Setting Up a Mission/Money Matrix
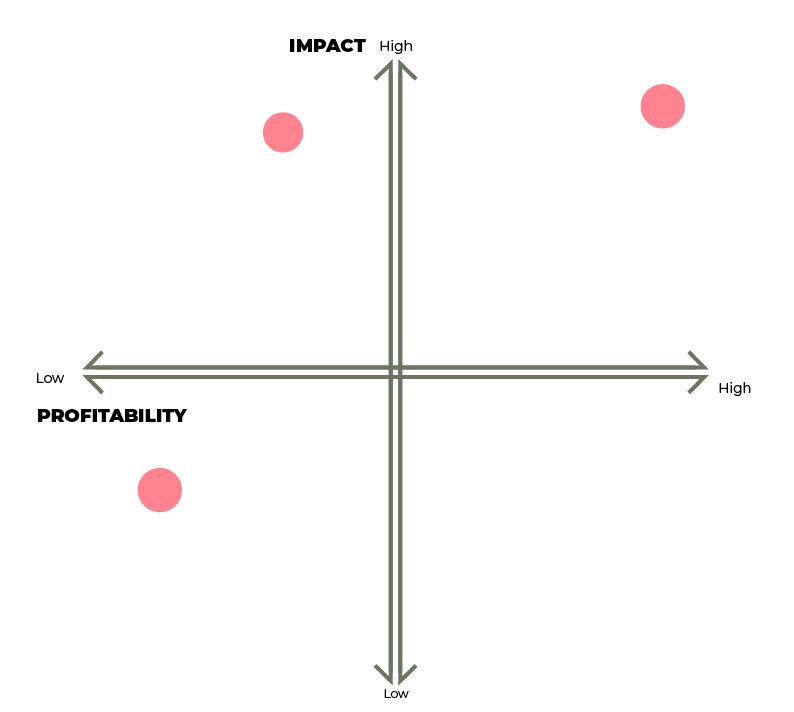
To use the Mission/Money Matrix, picture a chart with two intersecting axes, Impact (vertical) and Profitability (horizontal), forming four quadrants. Identify each of your programs and plot them on the matrix based on:
- How much revenue does the program contribute to your bottom line after taking into account true program costs? (Profitability)
- How closely does the program align with your mission? (Impact)
A little homework is necessary to measure the profitability and impact of each program.
Measuring profitability and impact
Profitability
Profit is a simple calculation: revenue minus cost. On the revenue side, be sure to include both earned revenue and restricted grant revenue attributable to the program. The key to the profitability measurement, however, is identifying the true costs of each program.
When calculating program expenses, do not stop with the expenses directly associated with developing and delivering the program. Be sure to allocate shared costs such as the administrative infrastructure needed to support each program to the true program cost. Some programs generate a surplus, while others will show a loss.
Impact
Assessing the mission impact of each program or activity may be the most challenging aspect of the Mission/Money Matrix, but it is often the most enlightening. Your staff and board tend to think all the programs and activities are great and important, and they usually are. But this exercise asks that the programs be assessed relative to each other in order to generate differentiated scores.
This assessment relies on very specific and customized criteria that relate to your organization and its programs. Before you start, take the time to identify four or five criteria that are the most useful to assess mission impact. Examples of criteria include:
- Alignment with mission
- Excellence in execution
- Scale, volume, or reach
- Depth of impact
- Role in filling an important gap
- Value in building community
- Leverage of other programs
Once the criteria have been identified, ask key staff and board members to assess each program or activity along each criterion on a scale of 1 to 4. Calculate the average of all the scores for each program to determine its overall “mission impact” score.
Note: This is fundamentally a subjective process.
Once you have identified the programs, and calculated their profitability and their mission impact, you are ready to plot them on the Mission/Money Matrix. When plotting each program, use different sized circles corresponding to the size of that program’s true costs. In other words, if the true costs for Program A are twice as much as the expenses for Program B, the circle for Program A would be twice as big as the circle for Program B on the matrix.
Pro tip
Each individual’s perceptions of the organization’s programs and activities will differ. Depending on your organization, you may find it useful to anonymize and equalize all responses, or to assign different weights to different individuals or impact criteria. The point is to produce a number that measures the mission value of each program against all others in your organization.

Evaluating the results and taking action
After plotting all of your programs and activities in the four quadrants, you are ready for strategic discussions with your staff and board.
What programs or activities must continue?
What programs or activities do not add enough value relative to other options and opportunities?
Where should you focus your attention in your effort to be strategic in its organizational development?
-
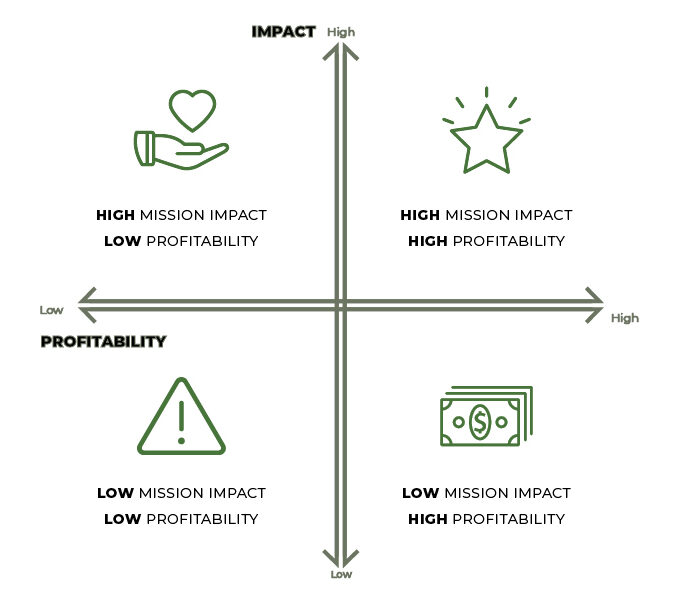
Potential actions for High Mission Impact/High Profitability programs and activities include:
- Invest to help it grow even stronger
- Celebrate strong financial contributors
- Watch to make sure it stays strong by not taking it for granted
-
Potential actions for High Mission Impact/Low Profitability programs and activities include:
- Celebrate its strong contribution to mission
- Consider ways to reduce costs
- Generate more revenue, based on the strength of its impact
- Identify how this program is subsidized
-
Potential actions for Low Mission Impact/High Profitability programs and activities include:
- Explore ways to increase the mission impact
- Continue to nurture it to sustain its financial value
- Celebrate the financial support it provides to other programs
-
Potential actions for Low Mission Impact/Low Profitability programs and activities include:
- Explore ways to increase mission impact and/or profitability
- Consider a timeline for improving or ending the program
- Consider transitioning the program to another organization
Instructions
Follow this process as described above under “Measuring profitability and impact.”
- Identify the revenue-generating programs and activities that your organization delivers.
- Calculate profitability for each program.
- Fill out Page 2 of the worksheet, listing your organization’s programs or activities in rows and mission impact criteria in columns.
- Distribute Page 2 to your organization’s key staff and board members, asking them to evaluate each program on a scale of 1 to 4, along the criteria listed in each column.
- Collect and tabulate all the responses and average them to arrive at an overall “Mission Impact” score for each program.
- Use Page 3 of the worksheet to plot each program on the Mission/Money Matrix.
- Identify goals or actions to sustain, improve, or reconsider your programs, based on the results.